Come nascondere le etichette dei dati con valore zero nel grafico di Excel?
Quando si creano grafici in Excel, l'aggiunta di Etichette dei dati aiuta a chiarire i punti dati e fornisce agli utenti un accesso diretto ai valori. Tuttavia, se i dati rappresentati nel grafico includono zeri, Excel spesso visualizza tali zeri come Etichette dei dati, causando potenziale confusione o rendendo il grafico meno gradevole dal punto di vista visivo. In molti contesti aziendali, accademici o di reporting, è comune preferire nascondere questi Etichette dei dati nulli, in modo che nel grafico vengano mostrati soltanto valori effettivamente significativi.
Fortunatamente, Excel offre diversi metodi pratici per nascondere gli zeri nelle etichette dei dati, ciascuno pensato per esigenze e flussi di lavoro differenti. Questa guida presenta gli approcci più diffusi, tra cui la formattazione integrata, soluzioni basate su formule e persino l’automazione con VBA. Continua a leggere per istruzioni dettagliate e suggerimenti utili, e assicurati che i tuoi grafici mostrino solo i dati rilevanti.
- Nascondi lo zero Etichette dei dati nel grafico tramite formato numerico personalizzato
- Formula Excel - Nascondi gli zeri tramite la formula SE in Dati di origine
- Codice VBA - Nascondi automaticamente lo zero Etichette dei dati tramite codice
Nascondi lo zero Etichette dei dati nel grafico tramite formato numerico personalizzato
Se si desidera nascondere le etichette dei dati con valore zero in un grafico senza modificare i dati originali, uno dei metodi più rapidi consiste nell’applicare un formato numerico personalizzato alle etichette dei dati. Questo approccio è particolarmente utile quando si vogliono conservare intatti i dati sottostanti — inclusi gli zeri — evitando semplicemente di visualizzare i valori pari a zero nel grafico.
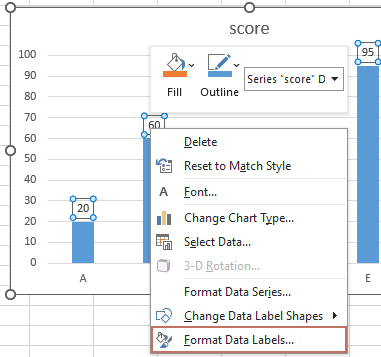
1. Innanzitutto, aggiungi le etichette dei dati al grafico secondo necessità. Poi fai clic con il pulsante destro del mouse su una qualsiasi delle etichette e seleziona Formato etichette dei dati dal menu contestuale. Vedi screenshot:

2. Nella finestra di dialogo Formato Etichette dei dati, fare clic su Numero nel riquadro sinistro. Scegliere quindi Personalizzato dall’elenco Categoria. Inserire il codice formato personalizzato #«» nella casella di testo Codice formato e fare clic su Aggiungi per salvarlo nell’elenco Tipi. Vedere screenshot:

Nota: In Excel 2013 o versioni successive, dopo aver fatto clic con il pulsante destro su un’etichetta dati e aver selezionato Formato Etichette dei dati, espandere Numero nel riquadro di formattazione, selezionare Personalizzato, inserire #«» come Codice formato e fare clic su Aggiungi.

3. Fare clic su Chiudi per uscire dalla finestra di dialogo. Ora, nel grafico verranno nascoste tutte le etichette dati con valore zero, lasciando visibili solo i valori diversi da zero.

Suggerimento: per ripristinare la visualizzazione degli zeri nelle etichette dei dati, torna alla finestra di dialogo Formato etichette dati, seleziona Numero > Personalizzato e scegli un formato numerico standard come #,##0;-#,##0 dall’elenco Tipi.
Questa soluzione è particolarmente efficace quando serve una correzione visiva rapida e funziona con la maggior parte dei grafici basati su numeri (ad esempio a colonne, a barre, a linee, ecc.). Tuttavia, se l’intervallo di origine viene aggiornato regolarmente con formule o valori zero variabili, potrebbe essere preferibile esplorare le soluzioni basate su formule o automatizzate descritte di seguito.
Attenzione: La formattazione numerica personalizzata nasconde visivamente gli zeri nel grafico, ma il valore effettivo rimane pari a zero in background e nei dati di origine.
Formula Excel - Nascondi gli zeri nel grafico con la formula SE in Dati di origine
Un altro metodo pratico per evitare che gli zeri Etichette dei dati appaiano nel grafico Excel consiste nel modificare i Dati di origine utilizzando una formula SE. Questo metodo sostituisce gli Valori zero nella Intervallo dati del grafico con celle vuote, impedendo al motore di creazione grafici di Excel di tracciare o etichettare tali punti. Questo approccio è particolarmente utile quando il grafico fa riferimento a una Intervallo dati dinamica o a formule e si desidera controllare quali dati vengono mostrati senza ulteriori passaggi di formattazione.
Scenari applicabili: Utilizza questa soluzione quando hai il controllo sui dati di origine (o puoi creare una colonna di supporto per il grafico) e desideri escludere completamente i valori zero dalle etichette o direttamente dalla serie del grafico.
Vantaggi: Semplice ed efficace: garantisce che gli zeri siano omessi sia dai punti dati del grafico che dalle relative etichette.
Svantaggi: Richiede la modifica dei dati esistenti o l’aggiunta di una colonna di supporto, se non si vuole alterare il set di dati originale.
Per implementare questa soluzione:
1. In una nuova colonna di appoggio o nell’intervallo dati esistente (ad esempio, supponendo che i valori originali siano nella colonna B a partire dalla cella)B2), inserisci la seguente formula nella cella corrispondente della colonna di appoggio (ad esempio, cella C2):
=IF(A1=0,"",A1)Questa formula verifica la cella C2: se il valore è zero, restituisce una cella vuota; altrimenti, restituisce il valore originale.
2. Premere Invio per confermare la formula. Copiare quindi la formula lungo i dati originali, se necessario, selezionando la cella che la contiene e trascinando il quadratino di riempimento oppure usando Ctrl+C / Ctrl+V.
3. Aggiorna l’intervallo dati del grafico in modo che faccia riferimento alla nuova colonna di supporto (ad esempio, la colonna)C), affinché la serie tracciata rifletta i valori aggiornati.
- Fare clic con il pulsante destro del mouse su qualsiasi etichetta dati esistente nel grafico e selezionare «Formato Etichette dei dati».
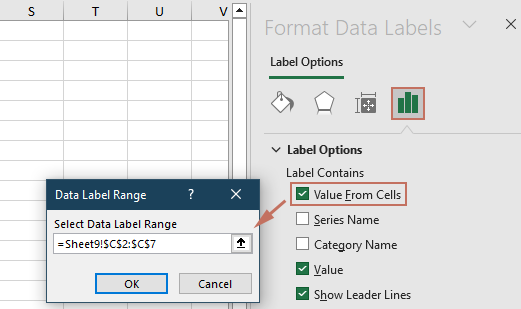
- In Opzioni etichetta, scegliere «Valore dalle celle». Si aprirà quindi una finestra di dialogo: selezionare l'intervallo della colonna di supporto e fare clic su OK.
- Deselezionare altre opzioni di etichetta, ad esempio «Valore».


Ora Excel non visualizzerà Etichette dei dati per i Valori zero, poiché le celle nei Intervallo dati del grafico sono effettivamente vuote (non zero). Come promemoria, assicurarsi che le celle vuote non vengano interpretate come zeri nelle impostazioni del grafico (ad esempio, per grafici a linee o Grafico a dispersione, verificare «Impostazioni celle nascoste e vuote» tramite Seleziona Dati → Celle nascoste e Celle vuote).
Promemoria sugli errori: Se la colonna delle formule contiene errori come #VALORE! in qualsiasi cella, tali punti potrebbero essere omessi o visualizzati con etichette di errore nel grafico: assicurati che la formula funzioni correttamente per tutte le righe.
Codice VBA - Nascondi automaticamente lo zero Etichette dei dati nel grafico
Per set di dati di grandi dimensioni, grafici aggiornati frequentemente o report ricorrenti, l’utilizzo di VBA offre un modo comodo ed efficiente per nascondere o rimuovere automaticamente gli zeri Etichette dei dati da un grafico Excel. La soluzione VBA è adatta quando si desidera automatizzare il processo o gestire più grafici contemporaneamente senza dover intervenire manualmente.
Scenari applicabili: Questo approccio è ideale per utenti a proprio agio con l’esecuzione di macro o quando si devono gestire attività complesse e ripetitive di creazione grafici su più cartelle di lavoro Excel.
Vantaggi: Automatizza la rimozione degli zeri dalle etichette dei dati, risparmiando tempo e riducendo il rischio di errori manuali. Funziona perfettamente anche quando i dati del grafico cambiano o quando crei dashboard soggette a frequenti aggiornamenti.
Svantaggi: Richiede l’abilitazione delle macro e una conoscenza di base delle procedure VBA. Le modifiche apportate tramite VBA potrebbero dover essere aggiornate se i dati o le serie del grafico vengono modificati dopo l’esecuzione.
Come utilizzare questa soluzione VBA:
1. Nella barra multifunzione di Excel, fai clic su Sviluppo > Visual Basic per aprire l’editor VBA. Nella finestra di VBA, fai clic su Inserisci > Modulo e incolla il seguente codice nel modulo appena creato:
Sub HideZeroDataLabels()
'Updated by extendoffice 2025/7/11
    Dim cht As Chart
    Dim s As Series
    Dim pt As Point
    Dim xTitleId As String

    On Error Resume Next
    xTitleId = "KutoolsforExcel"

    Set cht = Application.ActiveChart
    If cht Is Nothing Then
        MsgBox "Please activate the chart from which you want to hide zero data labels.", vbExclamation, xTitleId
        Exit Sub
    End If

    For Each s In cht.SeriesCollection
        For Each pt In s.Points
            If pt.HasDataLabel Then
                If pt.DataLabel.Text = "0" Or pt.DataLabel.Text = "0%" Then
                    pt.DataLabel.Delete
                End If
            End If
        Next pt
    Next s
End Sub2. Tornare al foglio di lavoro e attivare il grafico in cui si desidera nascondere gli zeri dalle etichette dei dati (facendo clic una volta sul bordo del grafico).
3. Torna all’editor VBA e fai clic sul pulsante ![]() Esegui(oppure premi)F5) per eseguire la macro. La macro esaminerà tutte le serie del grafico e nasconderà automaticamente ogni etichetta con valore zero, lasciando inalterate le altre etichette dei dati.
Esegui(oppure premi)F5) per eseguire la macro. La macro esaminerà tutte le serie del grafico e nasconderà automaticamente ogni etichetta con valore zero, lasciando inalterate le altre etichette dei dati.
Suggerimenti pratici: Se il grafico contiene più di una serie di dati, la macro gestirà ciascuna serie singolarmente. Puoi anche assegnare la macro a un pulsante personalizzato per un utilizzo ripetuto ancora più semplice.
Promemoria errori: Assicurati di aver abilitato le macro prima di eseguire il codice e che il grafico da elaborare sia attivo; in caso contrario, la macro visualizzerà un avviso.
Articoli correlati:
Migliori Strumenti per la Produttività in Office
Potenzia le tue competenze in Excel con Kutools per Excel e sperimenta un’efficienza mai vista prima.Kutools per Excel offre oltre 300 funzionalità avanzate per aumentare la produttività e Risparmia tempo.Clicca qui per ottenere la funzionalità di cui hai più bisogno...
Office Tab Porta l'interfaccia a schede in Office e rende il tuo lavoro molto più semplice
- Abilita la modifica e la lettura a schede in Word, Excel, PowerPoint, Publisher, Access, Visio e Project.
- Apri e crea più documenti in nuove schede all’interno della stessa finestra, invece che in finestre separate.
- Aumenta la tua produttività del 50 % e risparmia centinaia di clic del mouse ogni giorno!
Tutti i componenti aggiuntivi di Kutools in un unico programma di installazione.
Kutools for Office è la suite che include componenti aggiuntivi per Excel, Word, Outlook e PowerPoint, oltre a Office Tab Pro: la soluzione ideale per i team che lavorano su diverse app di Office.
- Suite completa— componenti aggiuntivi per Excel, Word, Outlook e PowerPoint + Office Tab Pro
- Un unico programma di installazione, una sola licenza— configurazione in pochi minuti (pronto per MSI)
- Funziona meglio insieme— produttività ottimizzata tra le app di Office
- Prova gratuita di 30 giorni con tutte le funzionalità— nessuna registrazione, nessuna carta di credito
- Miglior rapporto qualità-prezzo— risparmia rispetto all’acquisto dei singoli componenti aggiuntivi