Come estrarre i dati da un grafico o da un diagramma in Excel?
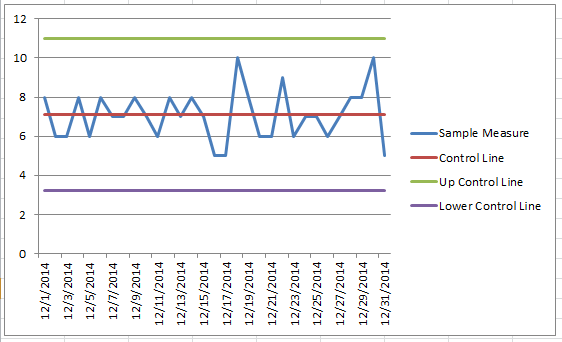
I grafici in Excel sono ampiamente utilizzati per visualizzare dati e tendenze in modo più efficace. Tuttavia, può capitare di avere a disposizione solo un grafico, senza accesso ai dati originali da cui è stato generato, come nell’esempio seguente. In questi casi, estrarre i dati direttamente dal grafico diventa essenziale. Questo tutorial offre una guida passo passo per recuperare i dati da un grafico o da un diagramma in Excel utilizzando codice VBA.
Estrai i dati dal grafico con VBA
1. È necessario creare un nuovo foglio di lavoro e rinominarlo in «ChartData». Vedere lo screenshot:

2. Seleziona il grafico da cui desideri estrarre i dati. Premi contemporaneamente i tasti «Alt» + «F11» per aprire la finestra di Microsoft Visual Basic, Applications Edition.
3. Fai clic su «Inserisci» > «Modulo», quindi incolla il codice VBA riportato di seguito nella finestra del modulo.
Sub GetChartValues()
    'Updateby20220510
    Dim xNum As Integer
    Dim xSeries As Object
    On Error Resume Next
    xCount = 2
    xNum = UBound(Application.ActiveChart.SeriesCollection(1).Values)
    Application.Worksheets("ChartData").Cells(1, 1) = "X Values"
    With Application.Worksheets("ChartData")
        .Range(.Cells(2, 1), _
        .Cells(xNum + 1, 1)) = _
        Application.Transpose(ActiveChart.SeriesCollection(1).XValues)
    End With
    For Each xSeries In Application.ActiveChart.SeriesCollection
        Application.Worksheets("ChartData").Cells(1, xCount) = xSeries.Name
        With Application.Worksheets("ChartData")
            .Range(.Cells(2, xCount), _
            .Cells(xNum + 1, xCount)) = _
            Application.WorksheetFunction.Transpose(xSeries.Values)
        End With
        xCount = xCount + 1
    Next
End Sub
4. Fai quindi clic sul pulsante «Esegui» per avviare la macro VBA. Vedere lo screenshot:

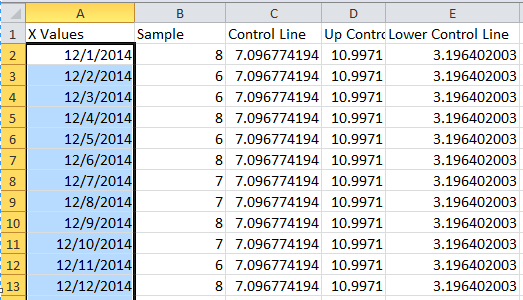
Potrai quindi visualizzare i dati estratti nel foglio «ChartData».
Suggerimento:
1. Puoi formattare le celle esattamente come desideri.
2. Per impostazione predefinita, i dati del grafico selezionato vengono estratti a partire dalla prima cella del foglio ChartData.
Suggerimento: se lavori spesso con grafici complessi in Excel, ricrearli ogni volta può diventare noioso. Con lo strumento «Testo automatico» di «Kutools per Excel», semplifichi l’operazione in un attimo: crea i tuoi grafici una sola volta, aggiungili al riquadro Testo automatico e riutilizzali quando vuoi e dove vuoi. Ti basterà aggiornare i riferimenti in base alle tue esigenze specifiche.
Kutools per Excel– Potenzia Excel con oltre 300 strumenti essenziali, rendendo il tuo lavoro più veloce e semplice, e sfrutta le funzionalità basate sull’IA per un’elaborazione dati più intelligente e una maggiore produttività.Scaricalo ora |

Migliori Strumenti per la Produttività in Office
Potenzia le tue competenze in Excel con Kutools per Excel e sperimenta un’efficienza mai vista prima.Kutools per Excel offre oltre 300 funzionalità avanzate per aumentare la produttività e Risparmia tempo.Clicca qui per ottenere la funzionalità di cui hai più bisogno...
Office Tab Porta l'interfaccia a schede in Office e rende il tuo lavoro molto più semplice
- Abilita la modifica e la lettura a schede in Word, Excel, PowerPoint, Publisher, Access, Visio e Project.
- Apri e crea più documenti in nuove schede all’interno della stessa finestra, invece che in finestre separate.
- Aumenta la tua produttività del 50 % e risparmia centinaia di clic del mouse ogni giorno!
Tutti i componenti aggiuntivi di Kutools in un unico programma di installazione.
Kutools for Office è la suite che include componenti aggiuntivi per Excel, Word, Outlook e PowerPoint, oltre a Office Tab Pro: la soluzione ideale per i team che lavorano su diverse app di Office.
- Suite completa— componenti aggiuntivi per Excel, Word, Outlook e PowerPoint + Office Tab Pro
- Un unico programma di installazione, una sola licenza— configurazione in pochi minuti (pronto per MSI)
- Funziona meglio insieme— produttività ottimizzata tra le app di Office
- Prova gratuita di 30 giorni con tutte le funzionalità— nessuna registrazione, nessuna carta di credito
- Miglior rapporto qualità-prezzo— risparmia rispetto all’acquisto dei singoli componenti aggiuntivi