Support is Online
We're back! We are here to assist you. Please be patient, we will respond to your tickets shortly.
Official support hours
Monday To Friday
From 09:00 To 17:30
  Thursday, 04 August 2022
  2 Replies
  5.8K Visits
0
Votes
Undo
Hello,
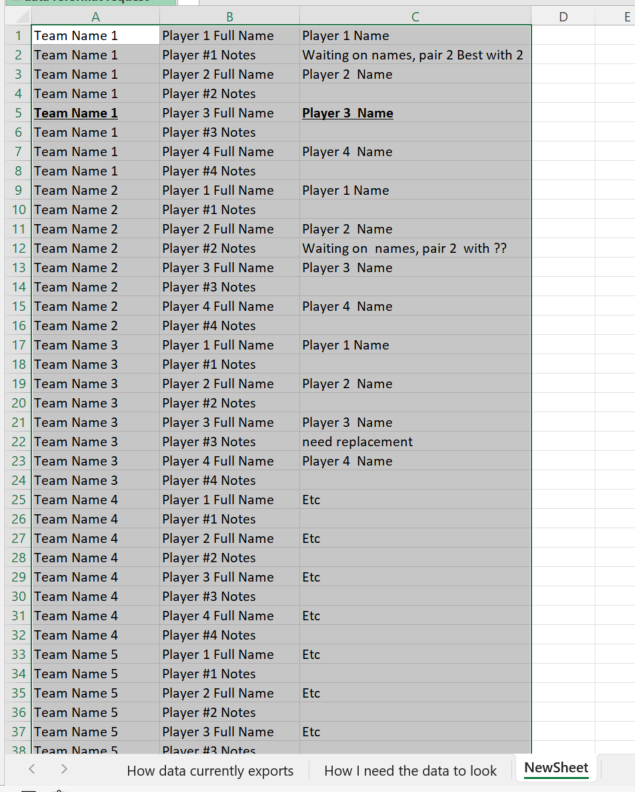
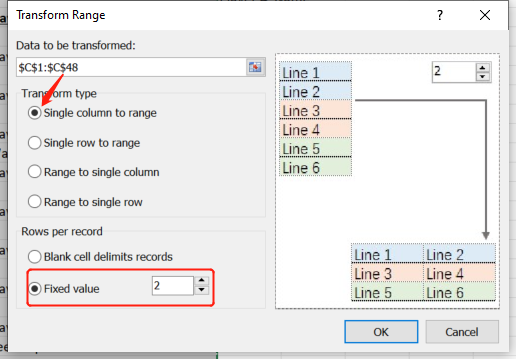
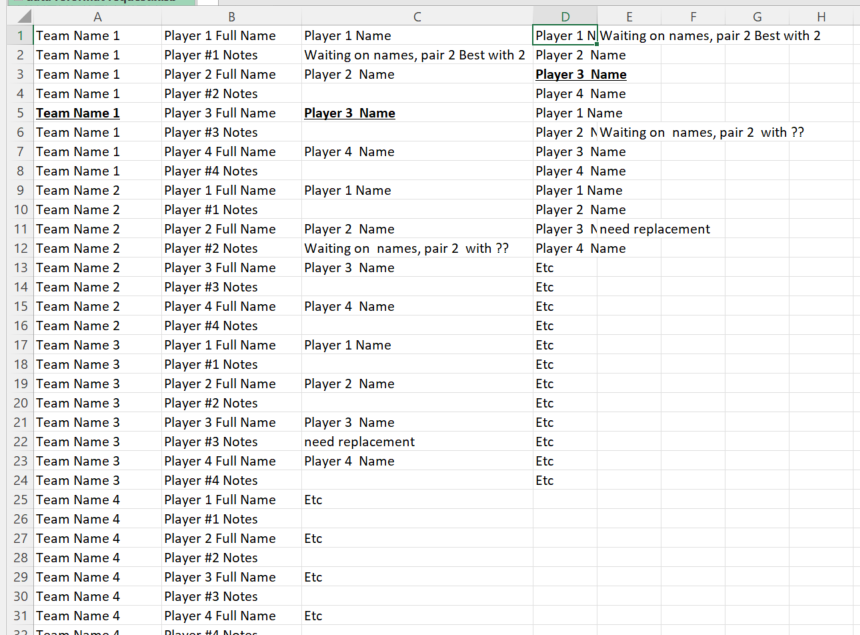
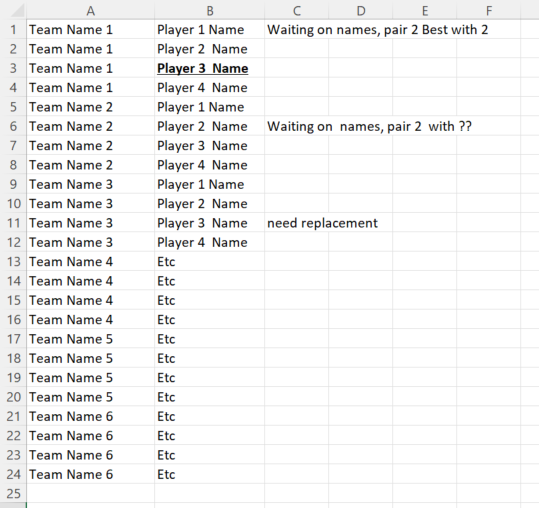
I'm pretty stumped on this one. the first TAB in the file shows how the data currently exports and that can't be changed. The second TAB shows how I need the data to look. I don't know the best and most efficient way to do this and appreciate any advice. If your tool will do this I will gladly buy it. :-)
Thank you!
1 year ago
·
#2995
Accepted Answer
0
Votes
Undo
Hi there,

Currently we don't have such a feature to directly do that for you. However, there is a workaround with Kutools' features (you can download and try it for free for 30 days):

1. Select the range 'How data currently exports'!$A$1:$I$7, then on the Kutools tab, click Range > Transpose Table Dimensions.
transpose.png

2. In the pop-up dialog, choose Cross table to list, and click the range-selection icon under the Results range section to select a cell where you want to output the result (here I created a new sheet and select the cell A1).
dialog.png

3. You will see the result as shown below. Now select the range C1:C48 and then on the Kutools tab, click Range > Transform Range.
result.png transform.png

4. In the pop-up dialog, choose Single column to range. In the Fixed value box, enter 2. Once finished, click OK.
dialog2.png

5. Specify the output range in the next pop-up dialog (here I select D1). You will see the results as shown below.
result2.png

6. Delete the column B and C. Select column A and then click Select > Select Interval Rows and Columns.
interval.png

7. In the pop-up dialog, choose Rows. Under Options, set 1 for both interval and rows number. Once finished, click OK. (Do not check Select entire rows)
dialog3.png

8. Right-click on any of the selected cells, and then click Delete. In the pop-up dialog, select Shift cells up.
shift.png

9. Now you will see the result as shown below. You can add headers for the table.
final result.png
1 year ago
·
#3000
0
Votes
Undo
Thanks a ton for the help!
  • Page :
  • 1
There are no replies made for this post yet.